Creation of a balanced scorecard
New technologies give us the option to control and manage large amounts of data. They enable the management and analysis of different data to monitor and analyze the company’s situation in real time.
Dashboards are the best option for summarizing a company’s information and seeing, from a global perspective, whether its objectives are being achieved.
This business management tool allows you to measure the progress, objectives, and results of a business.
Advantages of using a BSC

Using dashboards for your company will offer you various advantages:

Provides an overview of the company’s current situation
It allows you to identify the different processes within a company and focus on ensuring they function effectively.
Provides different approaches to managing a business

Perfect your company management
Evaluation of improvement techniques
Dashboard interface: Google Data Studio
Google Data Studio is one of the most comprehensive applications for creating dashboards, allowing you to connect to different applications to collect all your data.
On this platform, data is synchronized automatically. Using connectors and integrations, it obtains data from different systems and analyzes it.
Connection with applications
We integrate the dashboard with different applications.

Asana

Holded

Clientify

Moodle

WordPress

Any application with an API
Analyze the impact of your company’s actions
Research and analyze the impact of the different actions being carried out in your business on a single platform. Make smarter decisions for your company’s organization.
We link your company’s information across different programs and tools and display it using the most important indicators according to your company’s needs.
Monitor the visits your website is receiving, its impact on different social networks, the conversion rate, and the percentage of goals achieved.
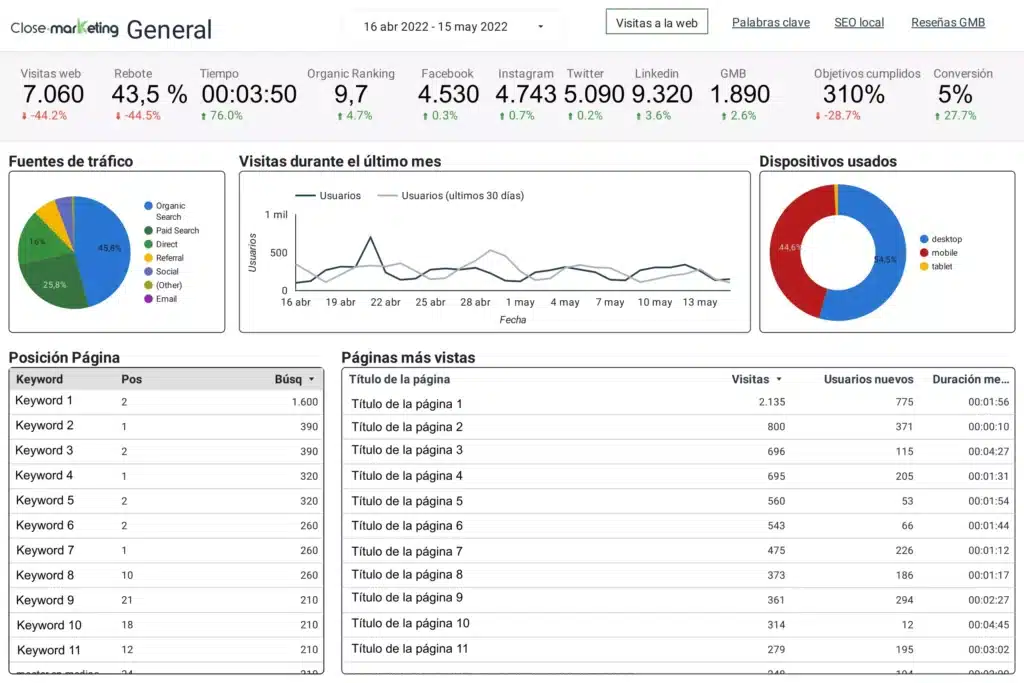
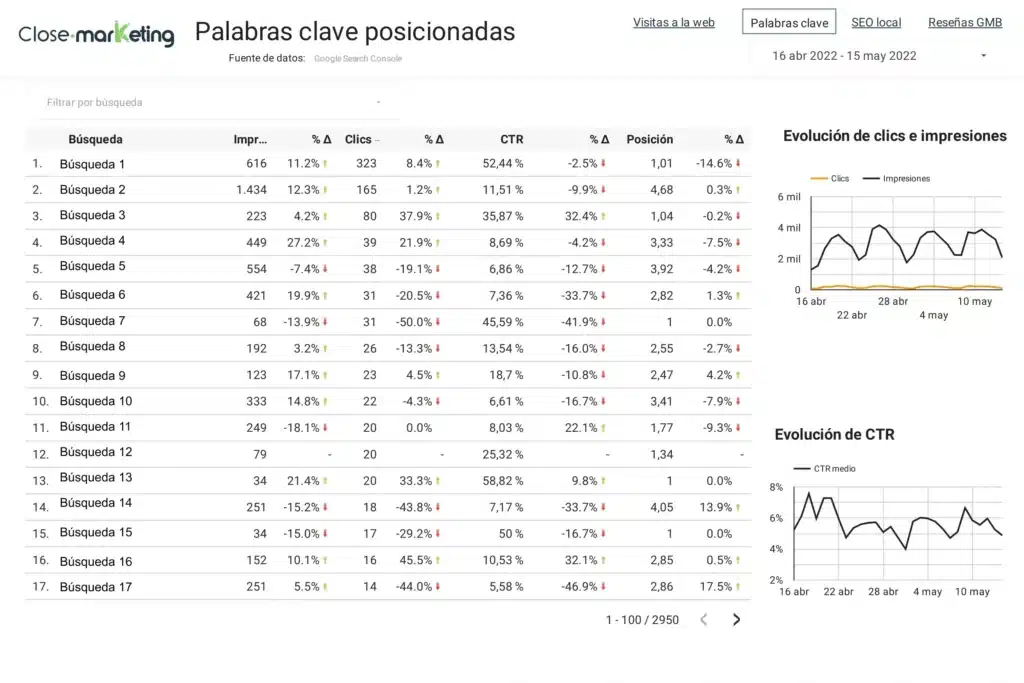
You can search for the main keywords so that your website appears among the top results in search engines. This will give you a guide to the different actions being implemented in the company.
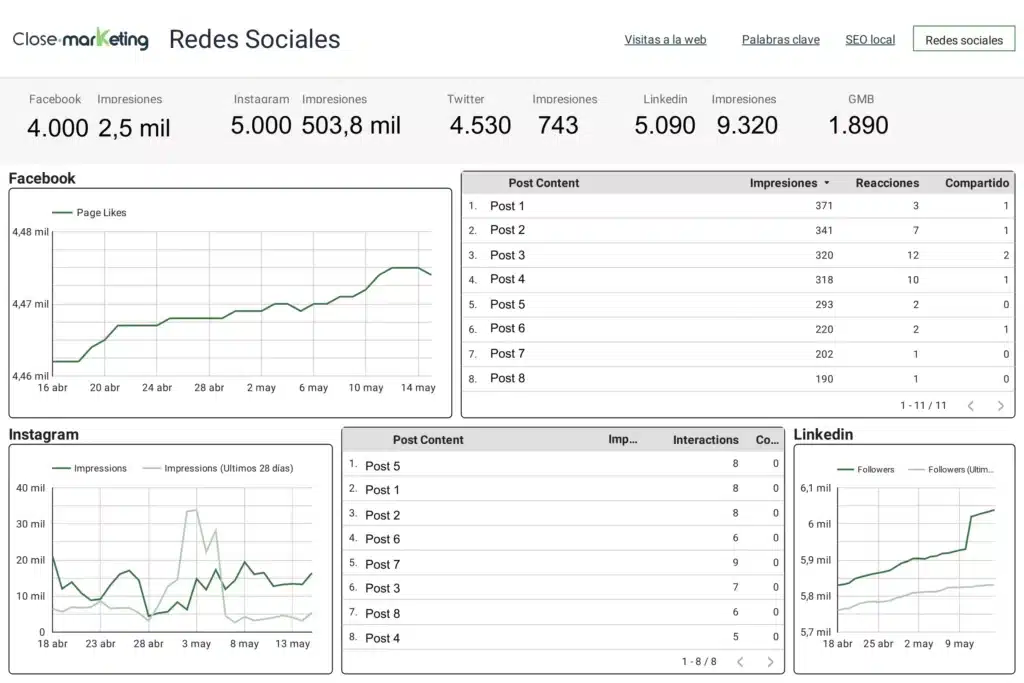
Study structured data on the impact of social media actions to better understand your audience.
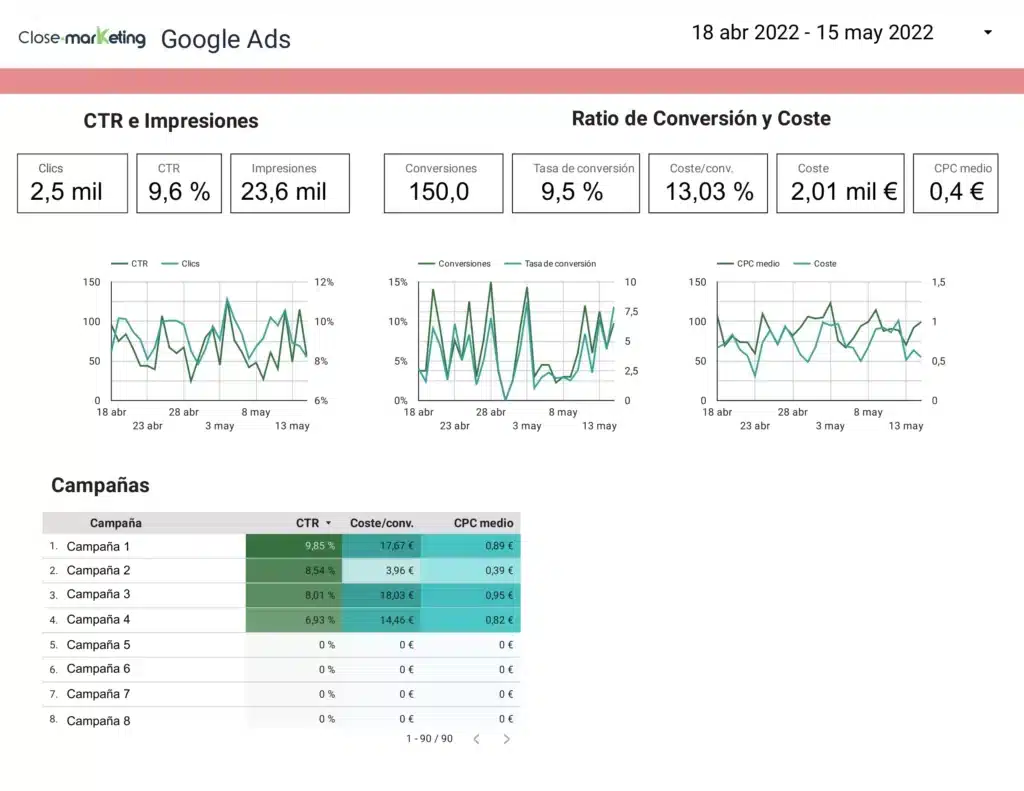
Collect the main indicators related to advertising on Google Ads to track and monitor the results obtained.
Would you like to have a comprehensive overview of your business by creating a dashboard?
Contact us!
"*" indicates required fields